N10-007 Given a scenario, analyze metrics and reports from monitoring and tracking performance tools
Baseline
In the simplest terms, a network performance baseline is a set of metrics used in network performance monitoring to define the normal working conditions of an enterprise network infrastructure. Engineers use network performance baselines for comparison to catch changes in traffic that could indicate a problem.
Setting a network baseline also provides early indicators that application and network demands are pushing near the available capacity, giving the networking team the opportunity to plan for upgrades. Aligning network performance baselines with existing network service-level agreements (SLAs) can help the IT organization stay within capacity parameters and identify problem areas that are falling out of compliance.
The network monitoring challenge for engineers, however, is to define what is normal for their organization’s infrastructure.
While building up your inventory of network devices to monitor, be sure to include both physical and virtual devices on your list. With the current trends in appliance and server virtualization, virtual switches (vSwitches) and virtualized application accelerators are important considerations when looking at network performance. Serving as network ports within the environment, vSwitches enable virtual machines to communicate with each other without having to traverse physical network adapters. While vSwitches speed inter-server communication, they don’t enable a network monitoring tool to report these paths or receive application performance data. Fortunately, the networking industry has recognized the problem and is working to improve the situation, either with more intelligent vSwitches or through virtual server standards such as Virtual Ethernet Port Aggregator (VEPA), which would enable exposure of virtualized network traffic to traditional network monitoring tools.
Bottleneck
Before you launch in detecting network bottlenecks, it’s worth checking, and eliminating, hardware problems with the NIC, or a broken cable. If you are not sure have a look at the device manager or even the system logs. Any doubts, try changing the network card and the cable, especially if this is an intermittent problem. Counters that may confirm a hardware problem are: Packets Outbound Errors and Packets Received Errors counters
Log management
In a network environment, all NOSs and most firewalls, proxy servers, and other network components have logging features. These logging features are essential for network administrators to review and monitor. Many different types of logs can be used.
Windows server and desktop systems such as Windows 7/Vista/XP and 2000 use Event Viewer to view many of the key log files. The logs in Event Viewer can be used to find information on, for example, an error on the system or a security incident.
Information is recorded into key log files; although, you will also see additional log files under certain conditions, such as if the system is a domain controller or is running a DHCP server application.
Event logs refer generically to all log files used to track events on a system. Event logs are crucial for finding intrusions and diagnosing current system problems. In a Windows environment, for example, three primary event logs are used: security, application, and system.
Graphing
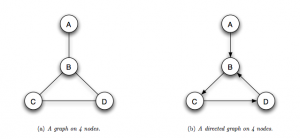
A graph is a way of specifying relationships among a collection of items. A graph consists of a set of objects, called nodes, with certain pairs of these objects connected by links called edges. For example, the graph in showing in figure 56 consists of 4 nodes labeled A, B, C, and D, with B connected to each of the other three nodes by edges, and C and D connected by an edge as well. We say that two nodes are neighbors if they are connected by an edge. Figure 56 shows the typical way one draws a graph — with little circles representing the nodes, and a line connecting each pair of nodes that are linked by an edge.
Recent Comments