N10-007 Given a scenario, analyze and interpret the output of troubleshooting tools
Command line tools
ipconfig
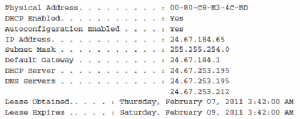
The ipconfig command is a technician’s best friend when it comes to viewing the TCP/IP configuration of a Windows system. Used on its own, the ipconfig command shows basic information such as the name of the local network interface, the IP address, the subnet mask, and the default gateway.
Combined with the /all switch, it shows a detailed set of information, as shown in the following example:

netstat
The netstat command displays the protocol statistics and current TCP/IP connections on the local system. Used without any switches, the netstat command shows the active connections for all outbound TCP/IP connections.
In addition, several switches are available that change the type of information netstat displays.
ifconfig
ifconfig performs the same function as ipconfig, but on a Linux, UNIX, or Macintosh system. Because Linux relies more heavily on command-line utilities than Windows, the Linux and UNIX version of ifconfig provides much more functionality than ipconfig. On a Linux or UNIX system, you can get information about the usage of the ifconfig command by using ifconfig —help. The following output provides an example of the basic ifconfig command run on a Linux system:
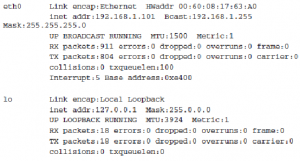
Although the ifconfig command displays the IP address, subnet mask, and default gateway information for both the installed network adapter and the local loopback adapter, it does not report DHCP lease information. Instead, you can use the pump -s command to view detailed information on the DHCP lease, including the assigned IP address, the address of the DHCP server, and the time remaining on the lease.
ping/ping6/ping -6
Most network administrators are familiar with the ping utility and are likely to use it on an almost daily basis. The basic function of the ping command is to test the connectivity between the two devices on a network. All the command is designed to do is determine whether the two computers can see each other and to notify you of how long the round-trip takes to complete.
Although ping is most often used on its own, a number of switches can be used to assist in the troubleshooting process. Table 8.5 shows some of the commonly used switches with ping on a Windows system.
TABLE 8.5 ping Command Switches

Ping works by sending ICMP echo request messages to another device on the network. If the other device on the network hears the ping request, it automatically responds with an ICMP echo reply. By default, the ping command on Windows-based system sends four data packets; however, using the –t switch, a continuous stream of ping requests can be sent. ping is perhaps the most widely used of all network tools; it is primarily used to verify connectivity between two network devices. On a good day, the results from the ping command are successful, and the sending device receives a reply from the remote device. Not all ping results are that successful. To use ping effectively, you must interpret the results of a failed ping command.
tracert/tracert -6/traceroute6/traceroute -6
The trace route utility does exactly what its nameimplies—it traces the route between two hosts. It does this by using ICMP echo packets to report information at every step in the journey. Each of the common network operating systems provides a trace route utility, but the name of the command and the output vary slightly on each. However, for the purposes of the Network+ exam, you should not concern yourself with the minor differences in the output format. Table 8.4 shows the trace route command syntax used in various operating systems.
TABLE 8.4 Trace Route Utility Commands

trace route provides a lot of useful information, including the IP address of every router connection it passes through and, in many cases, the name of the router. (Although this depends on the router’s configuration.) Trace route also reports the length, in milliseconds, of the round-trip the packet made from the source location to the router and back. This information can help identify where network bottlenecks or breakdowns might be. The following is an example of a successful tracert command on a Windows Server system:
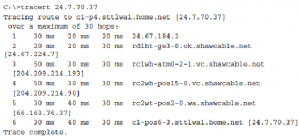
Similar to the other common operating systems covered on the Network+ exam, the tracert display on a Windows-based system includes several columns of information. The first column represents the hop number. You may recall that hop is the term used to describe a step in the path a packet takes as it crosses the network. The next three columns indicate the roundtrip time, in milliseconds, that a packet takes in its attempts to reach the destination.
The last column is the hostname and the IP address of the responding device.
Of course, not all trace route attempts are successful. The following is the output from a tracert command on a Windows Server system that doesn’t manage to get to the remote host:
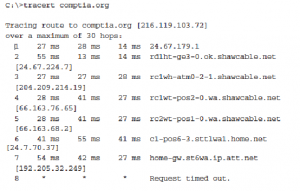

In this example, the trace route request gets to only the seventh hop, at which point it fails. This failure indicates that the problem lies on the far side of the device in step 7 or on the near side of the device in step 8. In other words, the device at step 7 is functioning but might not make the next hop. The cause of the problem could be a range of things, such as an error in the routing table or a faulty connection. Alternatively, the seventh device might be operating at 100 percent, but device 8 might not be functioning at all. In any case, you can isolate the problem to just one or two devices.
nbtstat
The nbtstat utility is used to view protocol statistics and information for NetBIOS over TCP/IP connections. nbtstat is commonly used to troubleshoot NetBIOS name resolution problems. Because nbtstat resolves NetBIOS names, it’s available only on Windows systems.
nslookup
nslookup is a utility used to troubleshoot DNS-related problems. Using nslookup, you can, for example, run manual name resolution queries against DNS servers, get information about your system’s DNS configuration, or specify what kind of DNS record should be resolved.
When nslookup is started, it displays the current hostname and the IP address of the locally configured DNS server. You then see a command prompt that allows you to specify further queries.
Certifiers
A cable certifier is a type of tester that enables you to certify cabling by testing it for speed and performance to see that the implementation will live up to the ratings. Most stress and test the system based on noise and error testing. You need to know that the gigabit cable you think you have run is actually providing that speed to the network.
Multimeter
One of the simplest cable-testing devices is a multimeter. By using the continuity setting, you can test for shorts in a length of coaxial cable. Or if you know the correct cable pinouts and have needlepoint probes, you can test twisted-pair cable.
A basic multimeter combines several electrical meters into a single unit that can measure voltage, current, and resistance. Advanced models can also measure temperature.
A multimeter has a display, terminals, probes, and a dial to select various measurement ranges. A digital multimeter has a numeric digital display, and an analog has a dial display. Inside a multimeter, the terminals are connected to different resistors, depending on the range selected.
Cable tester
A media tester, also called a cable tester, defines a range of tools designed to test whether a cable properly works. Any tool that facilitates the testing of a cable can be deemed a cable tester. However, a specific tool called a media tester enables administrators to test a segment of cable, looking for shorts, improperly attached connectors, or other cable faults. All media testers tell you whether the cable correctly works and where the problem in the cable might be.
A cable certifier is a type of tester that enables you to certify cabling by testing it for speed and performance to see that the implementation will live up to the ratings. Most stress and test the system based on noise and error testing. You need to know that the gigabit cable you think you have run is actually providing that speed to the network.
Toner probe
A toner probe is a device that can save a network installer many hours of frustration. This device has two parts: the tone generator, or toner, and the tone locator, or probe. The toner sends the tone, and at the other end of the cable, the probe receives the toner’s signal. This tool makes it easier to find the beginning and end of a cable.
You might hear the tone generator and tone locator referred to as the fox and hound. As you might expect, the purpose of the tone probe is to generate a signal that is transmitted on the wire you are attempting to locate. At the other end, you press the probe against individual wires. When it makes contact with the wire that has the signal on it, the locator emits an audible signal or tone.
Speed test sites
A fast website loads quickly and you are less likely to loose impatient website viewers. The relationship between a high bounce rate and a slow website has been tested and proved so you can’t afford to ignore your page speed. In addition Google has said they want to see websites that perform the best at the top of their results so they can deliver the highest quality results to their users. It is indeed a fact that Google are now using page speed in their algorithm. So we should all want our webpages to be fast – but how fast is fast and how would we improve the design of a slow loading page?
Testing Your Website Speed
The good news is that there are lots of high quality free tools out there that comprehensively test webpage performance in several different ways. Results are delivered in easy to interpret charts with explanations of the performance issues, suggestions for improvements and further reading. Most also provide some high level bench marking metrics so you can quickly understand if your site has a speed issue that you need to do something about.
Some good tools to try are; tools.pingdom.com, GTmetrix.com, webpagetest.org and of course developers.google.com/speed/pagespeed/insights/.
Looking glass sites
A Looking Glass is a piece of software running on a web server that allows external users to get a look at routing and network behavior as it originates from the remote network. A looking glass accesses a remote router and performs either a ping, trace, or one of several show commands allowing a view of the IP and BGP route tables.
The information is then returned as a web page.
Looking Glasses are most commonly used for verifying routing between providers, and for verifying that routes are propagating correctly across the Internet.
Protocol analyzer
Protocol analyzers are used to do just that—analyze network protocols such as TCP, UDP, HTTP, and FTP. Protocol analyzers can be hardware- or software- based. In use, protocol analyzers help diagnose computer-networking problems, alert you to
unused protocols, identify unwanted or malicious network traffic, and help isolate network traffic-related problems.
Like packet sniffers, protocol analyzers capture the communication stream between systems. But unlike the sniffer, the protocol analyzer captures more than network traffic; it reads and decodes the traffic. Decoding allows the administrator to view the network communication in English. From this, administrators can get a better idea of the traffic that is flowing on the network.
As soon as unwanted or damaged traffic is spotted, analyzers make it easy to isolate and repair. For example, if there is a problem with specific TCP/IP communication, such as a broadcast storm, the analyzer can find the source of the TCP/IP problem and isolate the system causing the storm.
Protocol analyzers also provide many real-time trend statistics that help you justify to management the purchase of new hardware.
Recent Comments