N10-007 Given a scenario, use appropriate monitoring tools
Packet/network analyzer
The term packet sniffer also refers to protocol analyzer or packet analyzer. Packet sniffers are used to monitor various packets that travel through the network. They run either on computers or they require dedicated hardware devices. There are various packet sniffers available in the market for example Wireshark, HP Open view etc.
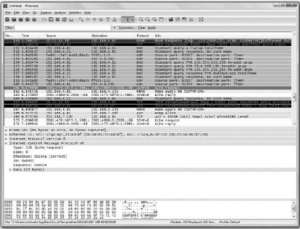
Figure 52: Wireshark
This is the working snapshot of wire sharp packet analyzer. It captures the packets leaving or entering the interface which we want to monitor and displays the output for testing, monitoring etc.
Interface monitoring tools
Network Interface monitoring tool provides the following data:
- Display real-time network monitoring statistics from routers and switches simultaneously
- Gather more than 200 standard and vendor proprietary statistics
At any given time, a virus or worm can infect a device on your network, creating a potential traffic nightmare for your routers and switches. Once you determine that a router or switch is routing significant amounts of traffic, you need an application that can isolate exactly which port is generating the traffic.
SolarWinds Network Interface Monitor can display many statistics from multiple routers and switches simultaneously. You can select from more than 30 statistic groups which include more than 400 standard and proprietary statistics. Statistics groups include:
- Traffic
- Interface/Port status
- Broadcast/Multicast
- Errors/Discards
- Interface/Port configuration
- Time data was last received/transmitted
- ARP cache
- Ethernet statistics
- Ethernet collisions
- Token ring statistics
- ATM AAL5 traffic
- Frame relay configuration
- Frame relay traffic
- DS1 line status
- DS1 last 15 minutes snapshot
- ADSL configuration
- AppleTalk® configuration
- 802.11 access point configuration
- 802.11 access point power levels
- 802.11 frame rates
- 802.11 access point last client
- 802.11 access point antennas
- Wireless clients (Cisco® APs)
- Wireless access point SSID (Cisco APs)
- Wireless bridges and repeaters (Cisco APs)
- ISDN line configuration
- Traffic rates (Cisco only)
- Queue errors (Cisco only)
- Slow vs. fast switching
- Protocols (Cisco only)
- IGRP settings
- Cisco discover protocol
Port scanner
Port scanner is the software that checks the ports on the system and displays their states. This is an important tool that is used to scan open ports on the system that might provide security risk as an open port can be used by unauthorized users to enter into the network. Examples of port scanners are NMAP, Angry IP scanner etc. NMAP works on the UNIX systems.
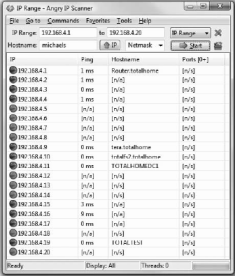
Figure 53: Port Scanner
Top talkers/listeners
Top talkers Display the computers sending most data, either from your network or into your network. On all the topN windows you can control the length of the list.
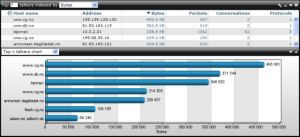
Figure 54: Top Talkers
Top Listeners
Display which of the discovered hosts are receiving most data, easily spotting hosts streaming or downloading large amounts of data from the internet.
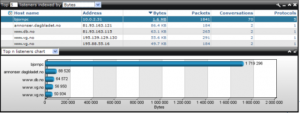
Figure 55: Top listeners
SNMP management software
It is a computer that runs a special piece of software that is termed as network management system (NMS). The cost of these applications depends on the functionality and support provided by them. Most of the NMS software uses graphical maps of the network for locating a device and issuing queries to it. These queries are in built and be issued by a click. SNMP and NMS make monitoring of devices possible from a single location. It is a lot of power and so it has to be implemented in a secure workstation
SNMP Agents: An SNMP manager resides on a PC. Every device needs to be SNMP enabled. To achieve this, a software component known as agent is used. It is a device that can run small components of software facilitating communication with the manager. It also intimates with the SNMP managers every time anything goes wrong.
A device running SNMP sends a trap to the NMS, when a certain condition is experienced. The action is then performed by the NMS. The actions that can be performed totally depend on the configuration.
SNMP Communities: SNMP communities are a logical grouping of systems. It simple means that when a system is configured as a part of a community, it would establish communication links with only those devices that share an identical community name. IT can accept commands like Get, Get Next, or Set from a manager with a community name that it recognizes. By default, two communities are defined: a read only community and a private community for the purposes of reading and writing. It proves useful as it can perform multiple functions.
Packet flow monitoring
As we have already seen, a flow is a bidirectional packet stream identified by a unique set of similar characteristics. J-Series Services Routers and SRX Series Services Gateways have designed around a flow-based architecture. By default, these devices inspect the network and transport layer attributes of incoming packets and create flow sessions for a set of seven IP attribute values:
- Source IP address
- Destination IP address
- Source port address
- Destination port address
- IP protocol
- IP type of service (ToS)
- Incoming interface
Subsequent packets with the same value for these attributes refresh existing flows and no new flows are created. Any deviation in packets from the attributes listed above will create a new flow.
Similar to flow-based architecture, the J-Flow service on J Series and SRX Series devices creates a J-flow table (J-Flow cache) for a set of network and transport layer attributes. These attributes vary with different J-Flow versions. A flow record is created in the J-Flow table when the first packet of a flow is processed. It is maintained within cache until the flow is active. Each flow record in the table contains key fields that can be used at a later time for exporting data to a collection device. As a flow record becomes active in a device, all packets with similar characteristics are tracked and counted, and certain fields in the flow record are updated. The flow record or J-Flow table information is exported to a flow collector server periodically, based on flow timers. The collector contains a history of flow information exported by different devices. Juniper Networks Junos® operating system also provides command-line interface (CLI) commands to retrieve and display flow records in the J-Flow table within a device.
SYSLOG
In addition to the specific logs mentioned previously, most UNIX/Linuxbased systems include the capability to write messages (either directly or through applications) to log files via syslog. This can be done for security or management reasons and provides a central means by which devices that otherwise could not write to a central repository can easily do so (often by using the logger utility).
SIEM
Security information and event management (SIEM) is an approach to security management that seeks to provide a holistic view of an organization’s information technology (IT) security. The acronym is pronounced “sim” with a silent e.
The underlying principle of a SIEM system is that relevant data about an enterprise’s security is produced in multiple locations and being able to look at all the data from a single point of view makes it easier to spot trends and see patterns that are out of the ordinary. SIEM combines SIM (security information management) and SEM (security event management) functions into one security management system.
A SIEM system collects logs and other security-related documentation for analysis. Most SIEM systems work by deploying multiple collection agents in a hierarchical manner to gather security-related events from end-user devices, servers, network equipment — and even specialized security equipment like firewalls, antivirus or intrusion prevention systems. The collectors forward events to a centralized management console, which performs inspections and flags anomalies. To allow the system to identify anomalous events, it’s important that the SIEM administrator first creates a profile of the system under normal event conditions.
Environmental monitoring tools
When discussing environmental monitoring, you often refer to the temperature of the server and network equipment rooms. In general, the heat tolerance range for computer equipment is surprisingly wide. For example, consider a typical server system, which can happily operate in a range between 50ºF and 93ºF (10º and 33.8º Celsius). That is a spread of 43ºF (23.8ºC), plenty of room in a normal heated environment. But the problem is that if you maintain a computer room at either the upper or lower end of these levels, the equipment will run, but for how long, no one knows.
Although no specific figures relate to the recommended temperature of server rooms, the accepted optimum is around 70º to 72ºF (21º to 22ºC). At this temperature, the equipment in the room should be able to operate, and those working in the room should not get too cold. Human beings generally require a higher temperature than computer equipment, which is why placing servers in an office space with staff is not ideal.
Many people assume that the biggest problem with servers and network equipment is overheating. To some extent, this is true; servers in particular generate a great deal of heat and can overheat to the point where components fail. But this is only one heat-related issue. A more significant, and more gradual, problem is that of temperature consistency.
Heat causes components to expand, and cooling causes them to contract. Even the slightest temperature shift causes the printed circuit boards and chips to shift, and if they shift too much or too often, the chance of their becoming separated from their connections is greatly increased. This is known as chip creep. Keeping the heat at a moderate and constant level reduces the expansion and contraction of the boards and increases the components’ reliability.
Recent Comments